Observability for Agentic Systems: Tracing Decisions, Tools, Data and Failure
A practical approach to observing agentic AI workflows across model decisions, tool calls, data access, policy, retries, latency, cost, and human escalation.
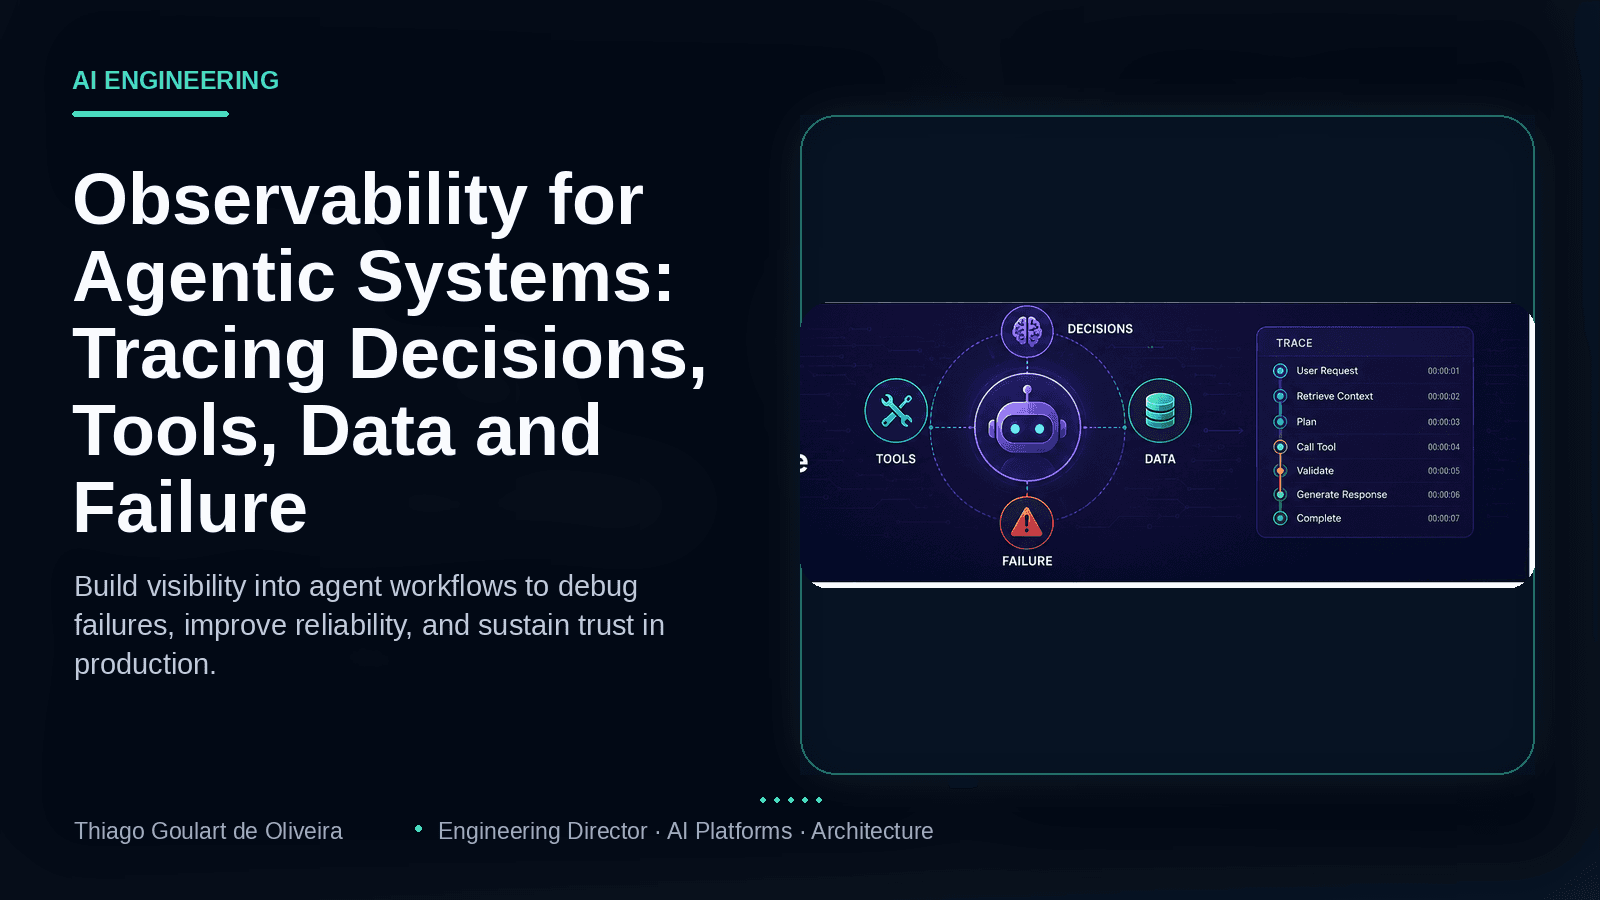
An agent can complete a task through many paths. Production observability must explain which path it took, why, what it accessed, and where the result became unreliable.
A traditional API request is often understandable through a trace:
- request enters;
- services are called;
- data is read or written;
- a response returns.
An agentic workflow is less predictable.
The system may:
- interpret the user's goal;
- retrieve context;
- select a tool;
- call an API;
- inspect the result;
- revise a plan;
- call another tool;
- retry;
- ask for clarification;
- escalate to a human;
- produce a final answer.
Two users can ask similar questions and trigger different paths.
The same question can produce a different path after a model, prompt, tool description, policy, or data change.
This flexibility is useful.
It also makes conventional application logging insufficient.
Production teams need to answer:
- What did the agent believe the user wanted?
- Which plan did it form?
- Which tools did it consider and select?
- Which data did it access?
- Which policy decisions applied?
- Why did it retry?
- Which step consumed latency and cost?
- Where did an incorrect answer first appear?
- Why did it answer instead of escalating?
- Can the result be reproduced?
Observability for agentic systems is the discipline of making that path inspectable without exposing sensitive information or drowning operators in raw prompts.
Begin With a Traceable Unit of Work
Every user task needs a stable correlation identity.
A useful trace may connect:
- session;
- conversation;
- user turn;
- agent run;
- model calls;
- retrieval;
- tool calls;
- policy checks;
- data queries;
- human handoff;
- final response.
Do not rely on timestamps and manual log searching to reconstruct a workflow.
Use trace and span identifiers consistently across:
- frontend;
- orchestration;
- model gateway;
- retrieval;
- APIs;
- data platforms;
- policy services;
- queues;
- human-review systems.
The trace should represent one business task, not merely one HTTP request.
Observe Intent and Planning Carefully
The system's internal representation of intent is often where the first error appears.
Capture structured fields such as:
- detected intent;
- entities;
- time range;
- units;
- user role;
- required capability;
- ambiguity;
- risk classification;
- selected workflow;
- planning version.
Avoid logging unrestricted private reasoning or sensitive chain-of-thought-like content.
Production observability does not require exposing hidden reasoning. It requires recording the decisions and inputs necessary to explain behavior.
For example:
{
  "intent": "retrieve_adjusted_inventory",
  "facility": "terminal-north",
  "time_window": "next-operating-window",
  "unit": "m3",
  "ambiguity_detected": true,
  "clarification_requested": true
}
This is more useful and safer than an unstructured block of model text.
Trace Tool Selection and Execution
For each tool decision, record:
- tools available to the agent;
- tool selected;
- tool version;
- reason code or structured selection category;
- input schema version;
- validated parameters;
- authorization context;
- execution start and end;
- status;
- retry;
- result size;
- result classification;
- error category.
Do not log credentials or unrestricted sensitive payloads.
A tool call should be attributable to:
- initiating user;
- agent;
- delegated identity;
- policy decision;
- task.
This is especially important when an agent can take actions rather than only retrieve information.
Observe Data Provenance
A correct answer depends on correct data.
Capture:
- source system;
- dataset or API;
- schema version;
- record or result identifiers where permitted;
- data timestamp;
- freshness;
- query hash or safe representation;
- row count;
- transformation;
- unit conversion;
- quality status;
- authoritative-source decision.
For a conversational answer, provenance should survive through the final response.
If the response says a value is current, the trace should show the source timestamp and freshness policy that justified that claim.
If data from multiple systems conflicts, the trace should show which source was selected and why.
Treat Policy Decisions as First-Class Spans
Authorization and safety controls are often logged separately from application traces.
That creates gaps during investigation.
A policy span should record:
- policy name and version;
- subject;
- delegated actor;
- tenant;
- resource;
- action;
- relevant attributes;
- decision;
- reason code;
- obligations or filters;
- latency.
Do not log sensitive policy data unnecessarily.
The important outcome is that a team can explain why a tool or field was allowed, denied, or redacted.
Policy should not be hidden inside the model prompt.
It should be observable as an independent decision.
Make Retries Visible
Agents may retry because:
- a tool timed out;
- a query failed;
- validation rejected parameters;
- a result was empty;
- the model changed its plan;
- a policy denied access;
- output failed formatting;
- confidence was low.
Retries can improve reliability.
They can also create:
- duplicate actions;
- unexpected cost;
- long latency;
- loops;
- repeated load;
- inconsistent state.
Record:
- retry reason;
- attempt number;
- changed input;
- backoff;
- idempotency key;
- outcome;
- retry budget.
Set explicit limits.
An agent that keeps “trying something else” without a bounded strategy is not resilient. It is uncontrolled.
Separate Model, Tool, and System Failures
A final incorrect answer may originate from different layers.
Model Failure
- wrong intent;
- inappropriate tool;
- unsupported conclusion;
- ignored evidence;
- poor summary.
Retrieval or Data Failure
- irrelevant context;
- stale data;
- missing record;
- wrong source;
- schema change;
- incorrect unit.
Tool Failure
- timeout;
- malformed response;
- partial success;
- API contract change;
- rate limit.
Policy Failure
- incorrect allow;
- incorrect deny;
- missing tenant filter;
- stale entitlement;
- enforcement gap.
Orchestration Failure
- wrong sequence;
- lost state;
- duplicate action;
- retry loop;
- context overflow.
Presentation Failure
- changed number;
- wrong formatting;
- hidden qualifier;
- misleading confidence.
Classify failures at the layer where they begin.
Otherwise, every incident becomes “the AI was wrong,” which is too vague to fix.
Measure Latency as a Critical Path
End-to-end latency is the sum of many steps, but not every step is equally important.
Trace:
- queue time;
- model time;
- retrieval time;
- policy time;
- tool time;
- database time;
- retries;
- human wait;
- response rendering.
Identify:
- critical path;
- parallel work;
- repeated context construction;
- expensive tools;
- unnecessary model calls;
- serial policy checks;
- slow fallbacks.
Track percentiles by workflow and complexity, not only a global average.
An operational lookup and a complex investigation should have different expectations.
Attribute Cost to the Task
Agent cost can include:
- input and output tokens;
- embedding and retrieval;
- model calls;
- tool/API fees;
- database compute;
- data transfer;
- retries;
- human review;
- incident handling.
Record cost at:
- model call;
- tool call;
- agent run;
- user task;
- feature;
- tenant or team where appropriate.
Useful metrics include:
- cost per successful task;
- cost per accepted answer;
- cost by workflow;
- cost of retries;
- cost of failed runs;
- cost by model;
- cost by complexity.
A lower model price does not guarantee a lower task cost if it causes more retries or failures.
Monitor Quality Signals Without Treating Them as Truth
Production signals may include:
- thumbs up/down;
- user edits;
- repeated questions;
- answer copied;
- task abandoned;
- correction requested;
- tool result opened;
- human escalation;
- support ticket;
- incident.
These are useful, but ambiguous.
A copied answer may be wrong.
A repeated question may reflect a changed intent.
A negative rating may concern tone rather than correctness.
Combine behavior with evaluation and trace context.
Design Privacy Into Observability
Agent traces can contain:
- user prompts;
- personal data;
- business data;
- retrieved documents;
- tool parameters;
- API responses;
- model output;
- security decisions.
Logging everything by default creates a second sensitive data platform.
Apply:
- data minimization;
- field classification;
- redaction;
- tokenization;
- sampling;
- role-based access;
- retention;
- encryption;
- regional controls;
- audit of trace access.
Store structured metadata whenever it can answer the operational question without storing full content.
Allow deeper capture for controlled debugging, with explicit authorization and limited retention.
Build Operational Views for Different Audiences
Engineering
Needs:
- traces;
- errors;
- retries;
- latency;
- cost;
- versions;
- dependencies.
Product
Needs:
- task success;
- adoption;
- clarification;
- abandonment;
- workflow performance;
- user outcomes.
Security and Risk
Needs:
- access decisions;
- tool use;
- sensitive-data events;
- policy violations;
- delegated actions;
- auditability.
Operations
Needs:
- service health;
- failed workflows;
- degraded dependencies;
- escalation queues;
- impact.
Leadership
Needs:
- reliability;
- value;
- cost;
- risk;
- trend;
- improvement.
One dashboard should not attempt to serve every audience.
Useful Metrics
Track at least:
- successful task completion;
- clarification rate;
- escalation rate;
- tool success;
- validation rejection;
- policy denial;
- retry count;
- loop prevention;
- unsupported-answer rate;
- grounding coverage;
- end-to-end latency;
- cost per successful task;
- stale-data detection;
- human correction;
- incident frequency;
- performance by workflow and version.
Avoid optimizing one metric in isolation.
Reducing escalation may increase unsafe answers.
Reducing latency may remove validation.
Reducing cost may increase retries.
The metric set must preserve the product's risk balance.
Version Everything Needed for Reproduction
A trace should reference:
- model and configuration;
- prompt template;
- tool definitions;
- orchestration version;
- semantic-layer version;
- policy version;
- schema version;
- retrieval index;
- feature flags;
- relevant data timestamp.
Exact reproduction may still be impossible because models and dependencies can be nondeterministic.
The system should at least make the conditions comparable.
Without versioning, teams cannot distinguish a random variation from a release regression.
Human Escalation Must Be Observable
When the agent hands work to a person, record:
- reason;
- risk level;
- evidence gathered;
- actions attempted;
- blocked action;
- missing information;
- recommended next step;
- queue;
- response time;
- outcome.
The human should not need to reconstruct the entire conversation manually.
A good handoff transfers context without transferring uncontrolled private data.
Escalation is part of the workflow, not an exception outside the system.
An Incident Investigation Example
Suppose an operator reports that an agent returned the wrong adjusted inventory.
A useful trace should allow the team to determine:
- The intent was interpreted as net standard volume.
- The correct facility and time window were selected.
- Authorization allowed that facility.
- The SQL query used the approved view.
- The source returned a value in liters.
- A formatting component labeled the value as cubic meters without conversion.
- The final response preserved the wrong label.
- The evaluation suite lacked that unit case.
This is actionable.
“The model hallucinated” is not.
A Practical Trace Model
A task trace can contain spans such as:
User task
├── Intent interpretation
├── Risk classification
├── Authorization
├── Semantic lookup
├── Tool selection
├── Query validation
├── Data query
├── Unit and format validation
├── Response generation
├── Output verification
└── User feedback or escalation
Each span should carry structured status, version, latency, cost, and safe diagnostic fields.
This makes the workflow understandable as a system.
Conclusion
Agentic systems are flexible because they can choose paths dynamically.
That same flexibility makes them difficult to operate without intentional observability.
A production trace must connect:
- user intent;
- model and orchestration decisions;
- tools;
- data;
- policy;
- retries;
- latency;
- cost;
- final output;
- human outcome.
The goal is not to record every internal token.
It is to make consequential decisions and transitions explainable.
When an agent succeeds, the team should understand why.
When it fails, the team should know where.
That is the foundation for improving reliability without treating every problem as mysterious model behavior.